Top 10 Best LLM Observability Tools in 2026
 William Imoh
You launch your AI application and expect a smooth rollout. It looks healthy from every angle and gives users clear, accurate answers. A few days after launch, users begin to raise concerns about the answers they receive. They report incorrect answers, made-up citations, and responses that contradict your product documentation.
You open your performance monitoring (APM) to search for the cause. All the services are running as they should. Based on your metrics, everything seems good. But according to the users, something's off.
This happens because LLM applications introduce quality failures instead of code errors. Traditional APM tools were not built to detect these semantic problems. This is why teams now see LLM observability as a complement to APM or logging stacks, not a replacement.
In this guide, I'll cover the best LLM observability tools AI teams are using in production in 2026. You'll learn how they monitor agent behavior, inspect autonomous agents, and track costs. I'll also compare their strengths, limits, use cases, and pricing to help you choose the right tool. Let's get started!
TL;DR: The 10 best LLM observability tools in 2026
The table below summarizes each tool's type, license, ideal team fit, and starting price. Find the use case that matches your needs in the "best suited for" column, then read its full review.
Tool | Type | Open source | Best suited for | Starting price |
|---|---|---|---|---|
Langfuse | Observability platform with tracing, eval, prompt management | Yes (MIT) | Teams that want a full open-source stack | Free self-host; Cloud from $29/mo |
LangSmith | Tracing + eval commercial platform | No | LangChain / LangGraph teams | Free tier; $39/seat/mo |
Arize Phoenix | Tracing + eval + drift detection | Source-available (Elastic 2.0) | Research and RAG-heavy teams | Free self-host; AX Pro $50/mo |
Helicone | Proxy/gateway logging | Yes (Apache 2.0) | Fast cost tracking | Free tier; Pro $79/mo |
Braintrust | Eval-first platform | No | CI/CD regression gating | Free tier; Pro $249/mo |
AgentOps | Agent-focused tracing | No | Multi-agent debugging | Free tier; paid tiers scale |
Laminar | Agent-focused tracing | Yes (Apache 2.0) | Cost-conscious agent teams | Free tier; Hobby $30/mo |
Galileo | Real-time eval + guardrails | No | Enterprise-scale guardrails | Custom pricing |
TruLens | Eval framework (library) | Yes (MIT) | Python-native RAG evaluation | Free |
Traceloop / OpenLLMetry | OpenTelemetry instrumentation | Yes (Apache 2.0) | Vendor-neutral instrumentation | SDK free; backend free tier |
Elastic License 2.0 is source-available, not OSI-approved open source. It lets you view, modify, and self-host the code, but it does not allow you to offer the software as a managed service to others.
10 best LLM observability tools
Now that you've seen a summary of each LLM observability tool, let's discuss them in more detail. Each one includes a summary, key features, pros and cons, best use cases, and pricing.
1. Langfuse
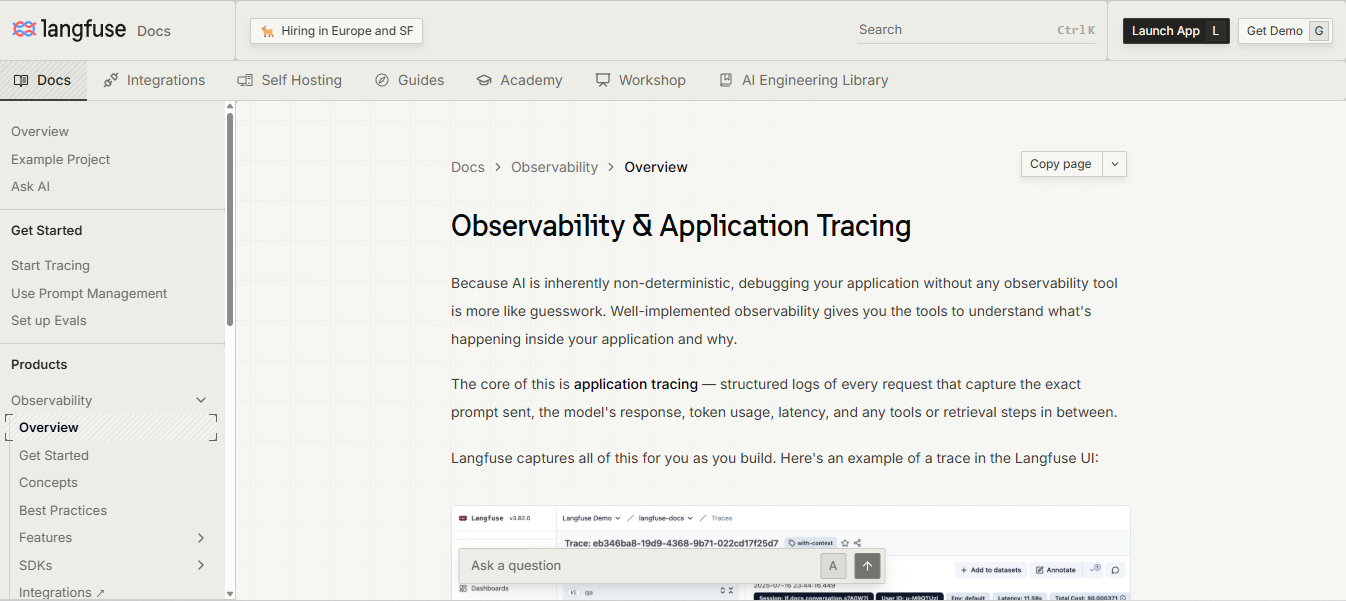
Langfuse is an open-source LLM observability platform that supports production AI applications. In June 2025, the platform moved almost all its core features to the permissive MIT license. This includes key tools such as prompt management and evaluation systems. The change lets teams run full tracing and testing on their own infrastructure at scale, without artificial limits or unpredictable operational costs.
Main features
Full tracing across LLM calls, tool calls, retriever steps, and agent workflows.
Prompt management with versioning, one-click deploys, and edge caching.
LLM-as-a-judge scores production traffic for hallucinations, toxicity, and relevance.
Human annotation workflows turn user feedback into structured evaluation datasets.
OpenTelemetry native instrumentation that avoids vendor lock-in.
Pros
Self-hosted deployment under MIT keeps all user traces within your own data perimeter.
OpenTelemetry's native design spans LangChain, LlamaIndex, and raw SDKs, with no vendor lock-in.
Prompt management lets you version and push prompts from a UI with no code deploy required.
Cons
Self-hosting demands heavy DevOps work across PostgreSQL, ClickHouse, Redis, and Kubernetes.
Fewer built-in evaluation metrics ship out of the box compared to LangSmith.
The Cloud free tier caps out at 50,000 monthly observations before you need a credit card.
Ideal for
AI engineering teams and developers who need LLM evaluation, prompt management, and full data control in one place. It covers all three under an open-source license, with nothing tying you to one provider.
Pricing
Langfuse offers a free self-hosted plan with no usage limit. It also includes a free Hobby cloud plan with 50,000 units per month. If you want to upgrade, the paid plans start with a Core plan at $29 per month for 100,000 units. They also have a Pro plan for $199 a month and an Enterprise plan for $2,499 a month. With the paid plans, you get team seats and can add extra units for $8 per 100,000.
2. LangSmith
LangSmith is LangChain's own observability platform for production of LLM applications. It delivers deep tracing for LangChain, LlamaIndex, and LangGraph projects. LangSmith creates a trace for every step in a chain, so you can inspect each one on its own. It gives you deeper insights into AI workflow behavior, but production traffic can increase tracing costs.
Main features
Nested trace trees follow every tool call and retrieval in an agent run.
Regression tests run through pytest and GitHub Actions to catch prompt issues before deploy.
Hybrid evaluation combines code checks with LLM-as-a-judge scoring to assess context relevance.
Annotation queues let team members review flagged traces and log structured feedback for each run.
Pros
30+ built-in evaluation metrics cover RAG checks, safety, and model-based scoring.
An execution graph view steps through multi-turn threads, loops, and tool calls one by one.
A single environment variable connects LangSmith to LangChain and LangGraph.
OpenTelemetry support pulls in existing traces from other observability tools.
Cons
Self-hosted deployment is available on the enterprise plan, unlike open-source tools.
Non-LangChain apps get less automated metadata mapping than native LangGraph setups.
Prompt Hub ties core features to LangChain, adding friction if you migrate later.
Ideal for
LangSmith suits teams that build with the LangChain or LangGraph framework. They want managed SaaS without having to run their own observability infrastructure.
Pricing
LangSmith offers a free developer plan that includes 5,000 base traces per month. It works well for teams that want to test LangSmith before moving to a paid plan. The plus plan costs $39 per seat per month and provides teams with access to 10,000 production traces. Both plans feature a pay-as-you-go model, charging $2.50 per 1,000 more traces. Teams can choose the enterprise plan for self-hosted or virtual private cloud deployments.
3. Arize Phoenix
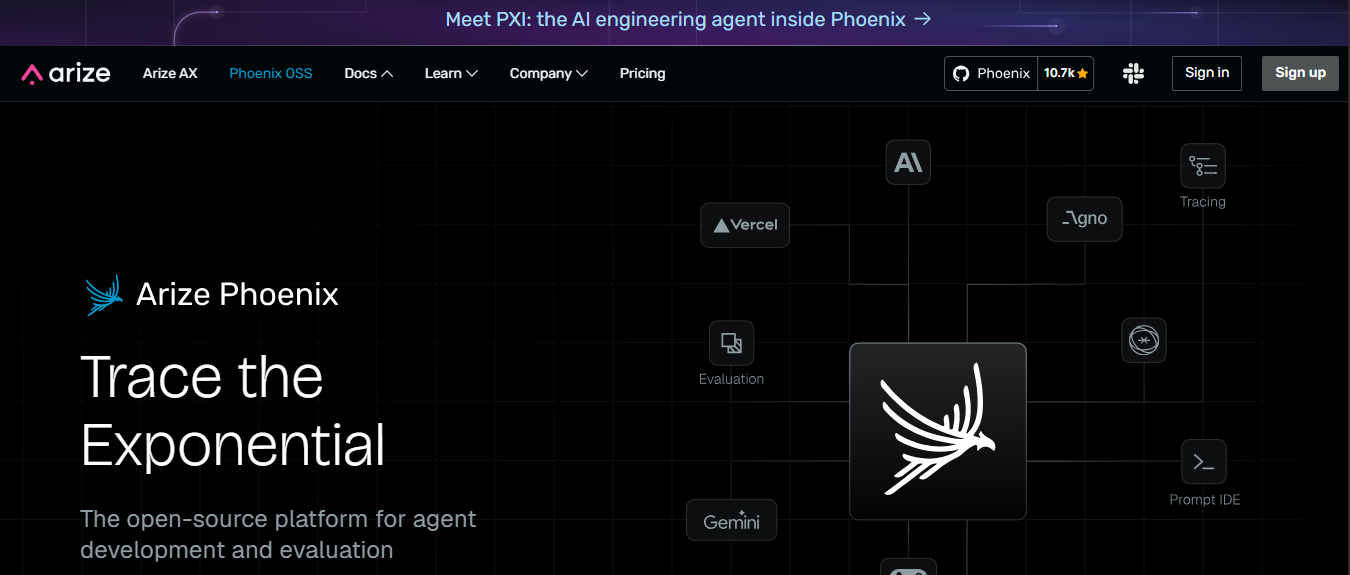
Arize Phoenix began as a tracing tool for machine learning (ML) research. It now provides a full AI observability platform under Elastic License 2.0. Phoenix uses embedding-based analysis to group similar production traces together. Its drift detection features help you find problems before users report them. Phoenix also stays OpenTelemetry-native, so traces work with existing observability infrastructure.
Main features
Span trees break down each step to spot slow LLM calls and bad tool selection quality.
OpenTelemetry native tracing, built on OpenInference, keeps telemetry data portable and open.
LLM-as-a-judge scores outputs for hallucination detection, correctness, and toxicity.
Pros
OpenTelemetry and OpenInference give you data control, even if you switch backends.
Agent graph views trace agent workflows and catch infinite tool calls or loop bugs.
Teams can scale from Phoenix into Arize AX for production monitoring and compliance.
Cons
High trace volume can overload memory and CPU on a self-hosted collector.
The open-source version has no alert webhooks, so drift checks remain manual.
Ideal for
AI engineers, data scientists, and developers building LLM apps, autonomous agents, or RAG pipelines.
Pricing
Arize Phoenix has a free, open-source plan with no ingestion or production trace limit. The AX free tier includes 25,000 spans and 1 GB of storage. Teams that need more capacity can choose AX Pro for $50 per month, with 50,000 spans and 10 GB of storage. Enterprise pricing depends on usage and includes unlimited models, custom retention, and more.
4. Helicone
Helicone combines an open-source AI gateway with LLM observability through a proxy-first setup. You route traffic between your application and LLM providers through Helicone's URL. This gives you a way to capture and analyze API traffic with near-zero code changes. The platform then tracks requests, token counts, costs, and latency. It gives developers the data they need to monitor, debug, and optimize external AI systems.
Main features
Proxy-based setup requires only a URL change, no SDK rewrite.
Cost and latency tracking runs at the request level across LLM providers (such as OpenAI).
Multi-model orchestration layer supporting 100+ distinct LLM endpoints.
Caching and rate limiting run inline at the proxy layer.
Pros
URL swap replaces complex SDK setup with a single change.
Semantic caching cuts token spend by catching repeat requests at the proxy.
Helicone requires minimal code changes to integrate observability.
Apache 2.0 license allows full self-hosted deployment for strict data residency needs.
Cons
Maintenance mode since the Mintlify acquisition keeps Helicone running, but the roadmap sits frozen with no new features planned.
No built-in evaluation metrics or native testing frameworks, so teams build that layer themselves.
Ideal for
Small- to mid-size teams that want speed and quick cost savings over deep AI evaluation.
Pricing
Helicone offers a free Hobby plan that includes 10,000 requests per month and 1 GB of storage. If you want to upgrade, the Pro plan is $79 a month with a 7-day free trial and unlimited seats. The Team plan is $799 per month and supports up to five organizations with SOC 2 compliance. If you exceed your limits, additional fees apply to Pro and Team customers. Enterprise customers can negotiate custom pricing and on-premises deployment under a sales contract.
5. Braintrust
Braintrust connects LLM evaluation and observability with ongoing production testing. Its evaluation system sends live traffic through an automated scoring pipeline. So teams can see why a model produced a response and track cost and performance metrics. They can also block CI/CD deployments if output quality falls below a set threshold.
Main features
Hybrid scorers mix code-based rules with automated grading for tone and accuracy.
Tracing trees map every prompt, retrieval step, and action into a single execution path.
CI/CD gating via a native GitHub Action blocks merges if output quality scores drop.
Pros
The free tier includes regression tests and CI/CD access with unlimited users.
Brainstore, Braintrust's custom trace database, runs sub-second searches through massive payloads without sampling.
Cons
Pricing meters data volume and scores together, complicating cost forecasting.
Self-hosting costs enterprise-level prices, which limits data privacy for smaller teams.
Ideal for
AI teams running important production apps with continuous deployment.
Pricing
Braintrust has a free plan that includes 1 GB of data, 10,000 evaluation scores, and a 2-week retention limit. If you want to upgrade to the Pro tier, it's $249 a month, and you get 5 GB of data, 50,000 scores, and a 30-day retention period. Teams that need a private cloud setup must sign up for a custom enterprise contract.
6. AgentOps
AgentOps focuses on how an autonomous agent makes decisions in live production environments. By contrast, traditional LLM monitoring only measures single-turn metrics such as request latency. AgentOps tracks complex, multi-step AI behaviors over longer tasks. It helps developers find and debug unpredictable errors in agents and loops.
Main features
Session replay lets teams rewind to any point and see what the agent knew.
Loop detection flags and halts agents stuck in repetitive, budget-draining logic.
One SDK covers 400-plus LLM providers and frameworks like CrewAI and LangChain.
Pros
Session waterfall replay rebuilds an agent's think-act-observe loop step by step.
Loop detection halts runaway agents before they burn through LLM credits.
Cons
A proprietary event model skips open standards like OpenTelemetry.
Data residency and compliance features sit behind custom enterprise plans.
Ideal for
Teams running multi-agent production systems that need execution graphs and loop detection.
Pricing
AgentOps offers a free Basic tier that lets you capture up to 5,000 events. It also comes with cost tracking and replay analytics. If you need more features, you can upgrade to the Pro plan for $40 per month. This plan has unlimited event capture and session exports. Enterprise customers can opt for cloud self-hosting, custom data retention, and more.
7. Laminar
Laminar is a newer open-source platform designed for AI agents from the start. It supports OpenTelemetry-native tracing with claimed 20x trace compression to reduce storage costs. Laminar combines a coding-agent debugger with raw SQL access for deeper workflow control. You can also self-host the platform, with all open-source features included.
Main features
Plain-language Signals flag infinite loops and other patterns in production traces.
OpenTelemetry native tracing covers Vercel AI SDK, LangGraph, and Pydantic AI with almost no setup code.
Self-hosted deployment through Docker or Kubernetes ships the full stack, no paywalls.
An MCP-based debugger lets tool calls pull telemetry and fix bugs on their own.
Pros
Self-hosted deployment keeps every feature open, with no enterprise paywall.
Hashing cuts telemetry storage by roughly 20x across long multi-turn conversations.
Cons
Local setup runs Postgres, Rust workers, and ClickHouse together; more parts than a single container.
Works as a trace recorder and debugger, not an AI gateway or optimization platform.
Smaller community than LLM observability platforms like Langfuse or Phoenix. You may find fewer troubleshooting threads for edge cases.
Ideal for
Engineering teams building autonomous agents and complex multi-turn workflows. It fits LLM applications that need debugging for long-running tool-calling loops.
Pricing
Laminar gives teams two free options: self-hosted and cloud-hosted. The free cloud hosting option includes 1 GB of storage and seven days of retention. The Starter plan costs $30 per month and includes 3 GB of data with unlimited seats. Pro plan costs $150 per month and extends retention to six months. For even more options, you can get a custom enterprise contract with custom data limits.
8. Galileo
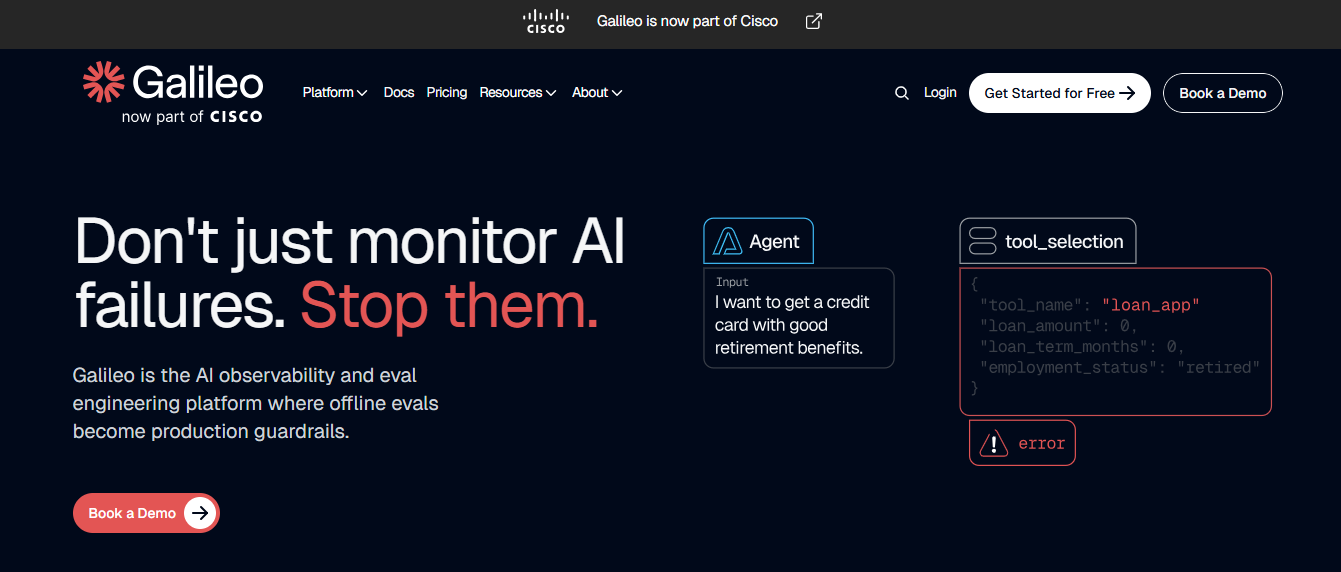
Galileo is an enterprise AI evaluation and observability platform for autonomous agents. It helps teams track, debug, and secure agents across the full development lifecycle. The platform adds quality evaluation metrics to infrastructure tracking for AI systems. It supports engineering teams from prompt optimization through production monitoring and guardrails.
Main features
Coverage spans the full agent workflows lifecycle from model selection to production.
Twenty-plus built-in evaluation metrics cover retrieval quality, bias, hallucination, and toxicity detection.
Live guardrails intercept harmful inputs or bad outputs mid-run, not after the fact.
Pros
A Graph Engine tracks multi-agent handoffs, routing loops, and tool execution paths.
Luna-2 models run evaluations under 200ms and cut costs far below LLM-as-a-judge setups.
Cons
Scoring logic and Luna-2 weights stay closed and vendor-controlled.
Runtime guardrail blocking sits behind Enterprise pricing tiers.
Ideal for
Teams that build multi-step workflows and AI agents with RAG applications in production. They need to catch hallucinations, track routing errors, and run live security guardrails.
Pricing
Galileo AI has a free plan for small teams with 5,000 monthly traces and unlimited custom evaluations. If you want more features, there's a pro tier for $100 per month that includes 50,000 traces and advanced analytics. For larger teams, the enterprise tier offers unlimited traces and live guardrails with custom pricing.
9. TruLens
TruLens is an open-source library for evaluating LLM applications through feedback functions. These functions support deterministic rules and LLM-as-a-judge scoring. You can use them to measure groundedness and accuracy in RAG pipelines and AI agents.
TruLens is now maintained by Snowflake following its acquisition of TruEra. It uses OpenTelemetry for deep system tracing. For enterprise teams, TruLens integrates directly with Snowflake Cortex to simplify production AI.
Main features
OpenTelemetry tracing maps functions, inputs, and outputs into standard spans.
Feedback functions use AI and rule-based checks to score groundedness, relevance, and accuracy.
Experiment tracking compares prompts, chunking strategies, and model variants side by side.
Pros
Free and self-hosted, with no paid tier locking any feature.
A code-first workflow that fits a Python evaluation pipeline.
Cons
No commercial support outside the Snowflake ecosystem.
Setup demands heavy engineering effort for custom feedback functions.
Ideal for
Python developers and data scientists who want code-first evaluation for their RAG pipelines. They can run detailed evaluations without paying for a commercial SaaS subscription.
Pricing
TruLens is a free, open-source evaluation tool and has no feature limits. The only costs you might incur are from running model-based evaluations. If you're using the Snowflake Cortex integration, you'll also have to pay Cortex fees.
10. Traceloop / OpenLLMetry
OpenLLMetry is an open-source set of OpenTelemetry extensions for LLM instrumentation. Traceloop built it, and its conventions helped seed the OpenTelemetry GenAI standard. It allows you to set up an LLM app once and route spans to any OpenTelemetry backend, such as Datadog.
Main features
RAG pipeline tracing tracks workflows through vector stores such as Pinecone and Chroma.
Token and cost tracking measures prompt size, completion length, and live pricing.
Auto-instrumentation covers major LLM providers and databases with almost no code.
Pros
Auto-instrumentation engine deploys across major providers with minimal code changes.
Granular cost tracking records token spend alongside exact call completion lengths.
Cons
No built-in evaluation playground means prompt tuning happens outside the collector.
No prompt routing or gateway layer means you use a separate tool for those features.
Ideal for
Teams that already use standard OpenTelemetry backends such as Datadog or New Relic.
Pricing
The free plan gives you up to 50,000 performance spans every month, five team seats, and 24-hour data retention. If you need more, there's the Enterprise plan with custom pricing. It comes with unlimited seats, custom data retention, SOC 2 compliance, and more.
How to choose an LLM observability tool
Selecting the right observability platform can prevent the need to change tools later. Choose a tool that fits your tech stack and solves your biggest problems.
Open source vs. managed SaaS
Teams with strict data residency requirements need a self-hosted core. Open-source licensing is another reason to choose a self-hosted core. It opens the code for legal review and removes any dependence on one vendor's roadmap. Five tools fit this criterion across three license types: Langfuse and TruLens both run on MIT. Laminar and Traceloop's OpenLLMetry share the Apache 2.0 license. Arize Phoenix stands apart under Elastic 2.0. The license costs nothing, but running the infrastructure still does.
Teams that want zero engineering involvement in managed infrastructure. These teams are also comfortable with using trace data hosted in the cloud. These traits are common among LangSmith, Braintrust, and Galileo.
Tracing, evaluation, or cost visibility
Match your tool choice to the team's most urgent need:
If the primary pain is debugging agent failures and tracing multi-step workflows, choose Langfuse, LangSmith, Laminar, or AgentOps.
If the primary pain is evaluating output quality and preventing regressions, choose Braintrust, Arize Phoenix, TruLens, or Galileo.
If the primary pain is cost visibility and multi-provider spend tracking with minimal setup, choose Helicone, but it is now in maintenance mode.
Framework and vendor lock-in
LangSmith gives LangChain and LlamaIndex teams deep first-party integration. The downside is that you might lock in with LangSmith more than you would with other tools in this guide. But Traceloop's OpenLLMetry gives teams that portability through an open standard. You can set up your app once and send the data to any compatible backend. To avoid getting locked into a single vendor, choose Apache 2.0 or MIT-licensed tools. Their licenses do not force you to use a SaaS-only version.
Consider the tool's current ownership and direction when choosing an observability tool. The LLM observability market saw significant ownership changes in 2026. ClickHouse now owns Langfuse; Mintlify owns Helicone; ServiceNow owns Traceloop; and Cisco plans to add Galileo to Splunk.
Langfuse pricing remains unchanged, while Helicone now focuses on maintenance. Traceloop remains open source under ServiceNow, and Cisco's plans will shape Galileo's roadmap. Check ownership status before you build a critical part of your stack around a tool.
Which LLM observability tool should you use?
Not every team is the same, so there isn't one tool that fits all. The following is a decision table that covers the common team situations:
Your situation | Recommended starting point |
|---|---|
Self-hosted, data sovereignty required, any framework | Langfuse (MIT) or MLflow |
LangChain or LangGraph stack, managed SaaS acceptable | LangSmith |
Eval-first, CI/CD regression gating, generous free tier | Braintrust |
RAG pipeline evaluation, OTel-native, research team | Arize Phoenix |
Multi-agent debugging, 400+ framework support | AgentOps or Laminar |
Multi-provider cost visibility, fastest setup | Helicone (maintenance mode) |
Vendor-neutral instrumentation, not yet committed to a backend | Traceloop / OpenLLMetry |
100% production traffic evaluation, real-time guardrails | Galileo (moving into Splunk) |
Python-native, RAG evaluation pipelines, open source | TruLens |
Experienced teams with complex needs often use more than one tool. For example, a team could use Traceloop for data capture and Langfuse for analysis. Another team might use Datadog for monitoring with Braintrust for model evaluation. These tools keep changing, and their prices and ownership can vary within months. So it's a good idea to reassess your stack at least once a year.
Next steps
A system can return a successful HTTP response yet still fail to meet user expectations. A hallucinated answer, a looping agent, or a prompt regression after a model update can affect the user experience before any alert reaches your team. LLM observability helps find out why AI systems fail and where they go wrong.
Choosing the right tool will impact how your team collects traces, stores evaluation data, and investigates failures. It's better to choose the best observability platform from the get-go than to try to switch everything over later.
If you are building with LLMs or AI agents, this is a good time to start building toward production-grade AI engineering. The AI agents and AI engineer roadmaps can help you plan that next step as you learn to build, test, track, and improve AI systems.
