What Is AI Observability? A Guide for Developers
 William Imoh
An AI feature can still fail without raising an app error, even if all the services it depends on return success. It can produce wrong answers, take too long to respond, or use more tokens than expected. Yet your monitoring dashboards may still show healthy services because the requests completed. Without seeing the steps behind each AI response, AI engineers may struggle to find why these issues occur.
Traditional monitoring can help you catch app errors and performance issues. But it doesn’t always explain why an AI feature returns the wrong answer or takes too long to respond. AI observability helps you investigate these issues by providing insight into AI workflows. You can track every step behind an AI response instead of only seeing whether the request worked. This will help you find failures, track output quality, and identify delays or extra costs.
In this guide, I'll cover the basics of AI observability, why developers need it, and how it works. I'll compare AI observability with traditional monitoring, ML model monitoring, and more. I'll also show you how to set up OpenTelemetry with Python and an open-source tracing tool.
What is AI observability?
AI observability is the practice of collecting and analyzing data from AI systems. This helps you assess system behavior, performance, cost, and output quality. It pairs the logs, metrics, and traces you already use with AI-specific data from AI workflows. That data includes prompts, model responses, token counts, retrieval results, and tool calls.
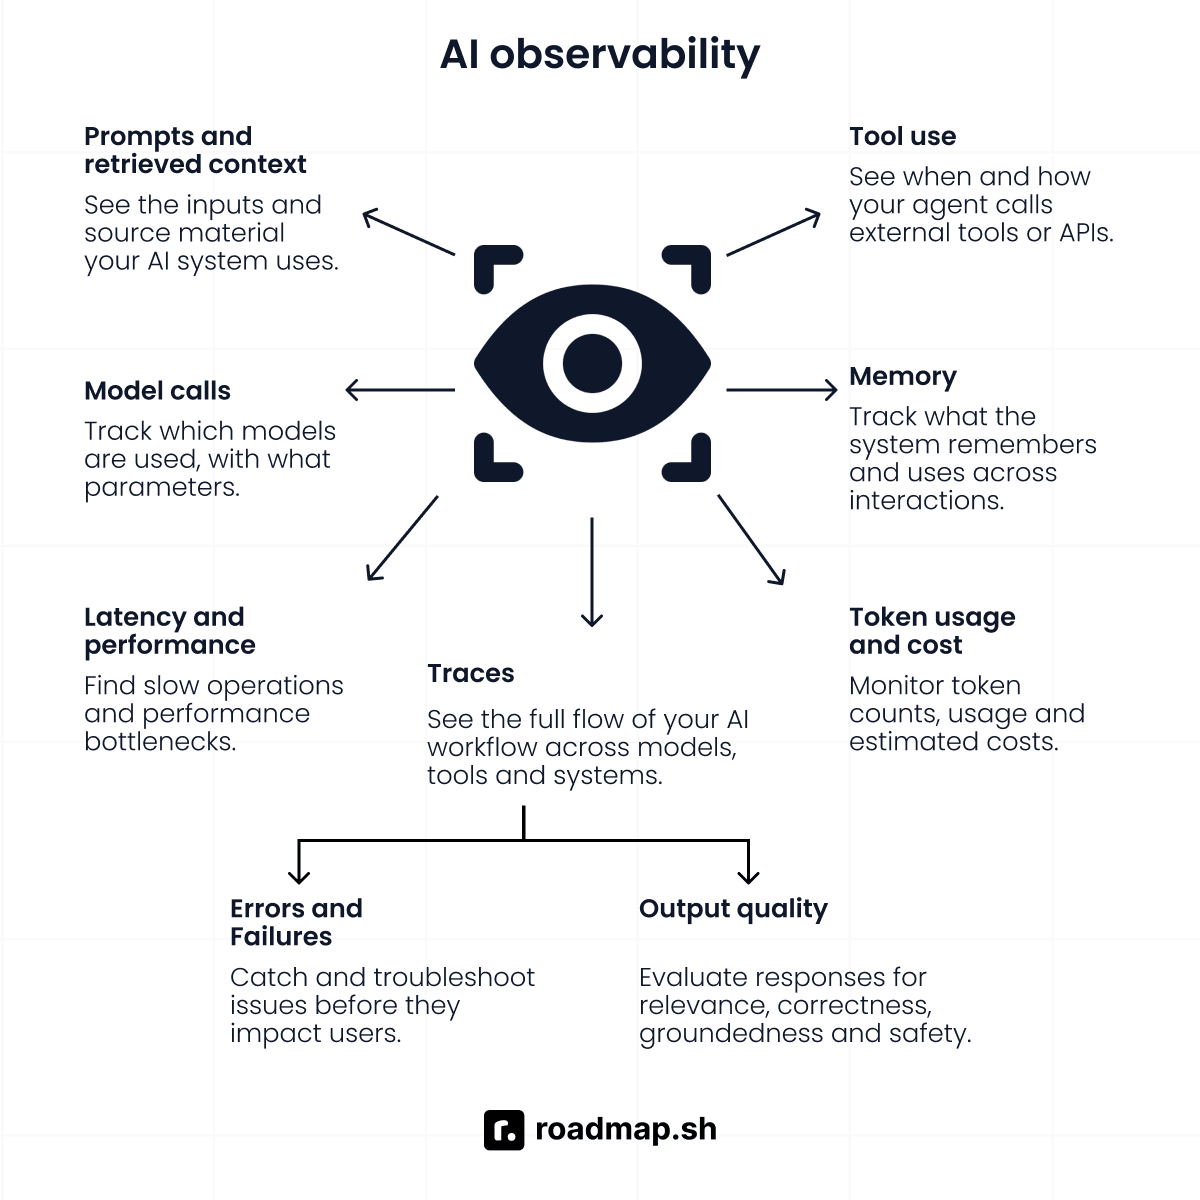
This data shows why a model returned a specific answer and which steps delayed the AI workflow. It also tracks each request's cost and whether a prompt or model update changed the results. AI observability covers four main types of AI systems:
Predictive machine learning (ML) models: Systems that predict results, sort data into categories, spot fraud, or forecast demand.
Large language model (LLM) applications: Systems that generate text or structured outputs, such as chatbots and code assistants.
Retrieval-augmented generation (RAG) pipelines: Systems that pull documents from external sources and pass them to LLM models as context.
Autonomous AI agents: Systems that use models to plan tasks, call tools, and take actions over several steps to reach a goal or stop.
Each AI system needs the right signals to help teams understand its behavior and spot issues. For example, a predictive ML model needs feature distributions and accuracy metrics. A RAG app needs retrieval scores and information about the documents it retrieves. An AI agent needs a full trace of its run, including model calls, tool usage, inputs, outputs, and errors. The goal is to link AI behavior to evidence that helps you find and fix problems.
Why AI observability matters
Traditional monitoring focuses on software errors, uptime, and response times. But AI systems can give different answers depending on:
The prompt
The data they find
The tools they use
A request might work, yet the model still gives a bad answer, and quality or cost changes may go unnoticed. AI observability helps you investigate these issues across five key areas:
Non-deterministic outputs
An LLM can return different results when you use the same prompt to complete a task. Sampling settings, model updates, and context differences can all affect the output. So, a model may pass a test but give a different answer in production for the same request.
Since AI responses can vary, AI observability helps you find bad outputs using regression testing techniques. You can compare traces from different runs to see what changed in the model’s behavior. This makes it easier to understand why the model gave an inaccurate answer or hallucinated.
Silent failures
An AI request can return a successful HTTP status code and still fail its task. For example, you may ask an AI coding assistant to fix a bug, and it returns code that introduces a new error. The request may succeed even though the suggested code fails to solve the problem. Traditional monitoring tracks request status, but it may miss errors in AI-generated responses.
AI observability lets you review the user's question, retrieved documents, and model response. Reviewing this data helps you see how the AI produced its answer and find errors. You can find whether the issue came from retrieval, the prompt, the model, or the application code.
Unpredictable costs
The cost of running AI applications can rise even when request volume stays the same. Longer prompts, larger responses, and extra model calls can increase costs. For example, an LLM application may send all 50 pages of a document to find one sentence. This uses more tokens than necessary and increases costs.
Traditional monitoring can show your servers are healthy, but it won’t tell you what’s raising AI costs. AI observability tracks token usage, model costs, retries, and repeated tool calls. You can use these data to optimize workflows, shorten prompts, and control costs.
Quality regressions
When you update your prompt or model, your AI may give poorer answers even if it runs fine. For example, a prompt change may cause an AI model to leave out key details in a summary. The model still responds, but you'll get less useful or accurate answers.
AI observability lets you compare AI performance across prompt versions and model updates. You can then fix problems or undo changes before more users experience them.
Accountability for agent actions
AI agents interact with external systems as they work through tasks. When an error occurs, the agent's final response may not show where things went wrong.
AI observability traces each step of an agent's workflow. Use these traces to find errors, assess security risks, and meet compliance requirements. You should also restrict access to traces that contain sensitive data.
How AI observability works
Now that you know what AI observability is and why it matters, let's look at how it works. Traditional observability relies on three core pillars: logs, metrics, and traces. AI observability adds AI-specific signals to these pillars. These signals capture data from model calls, retrieval systems, and agent runs.
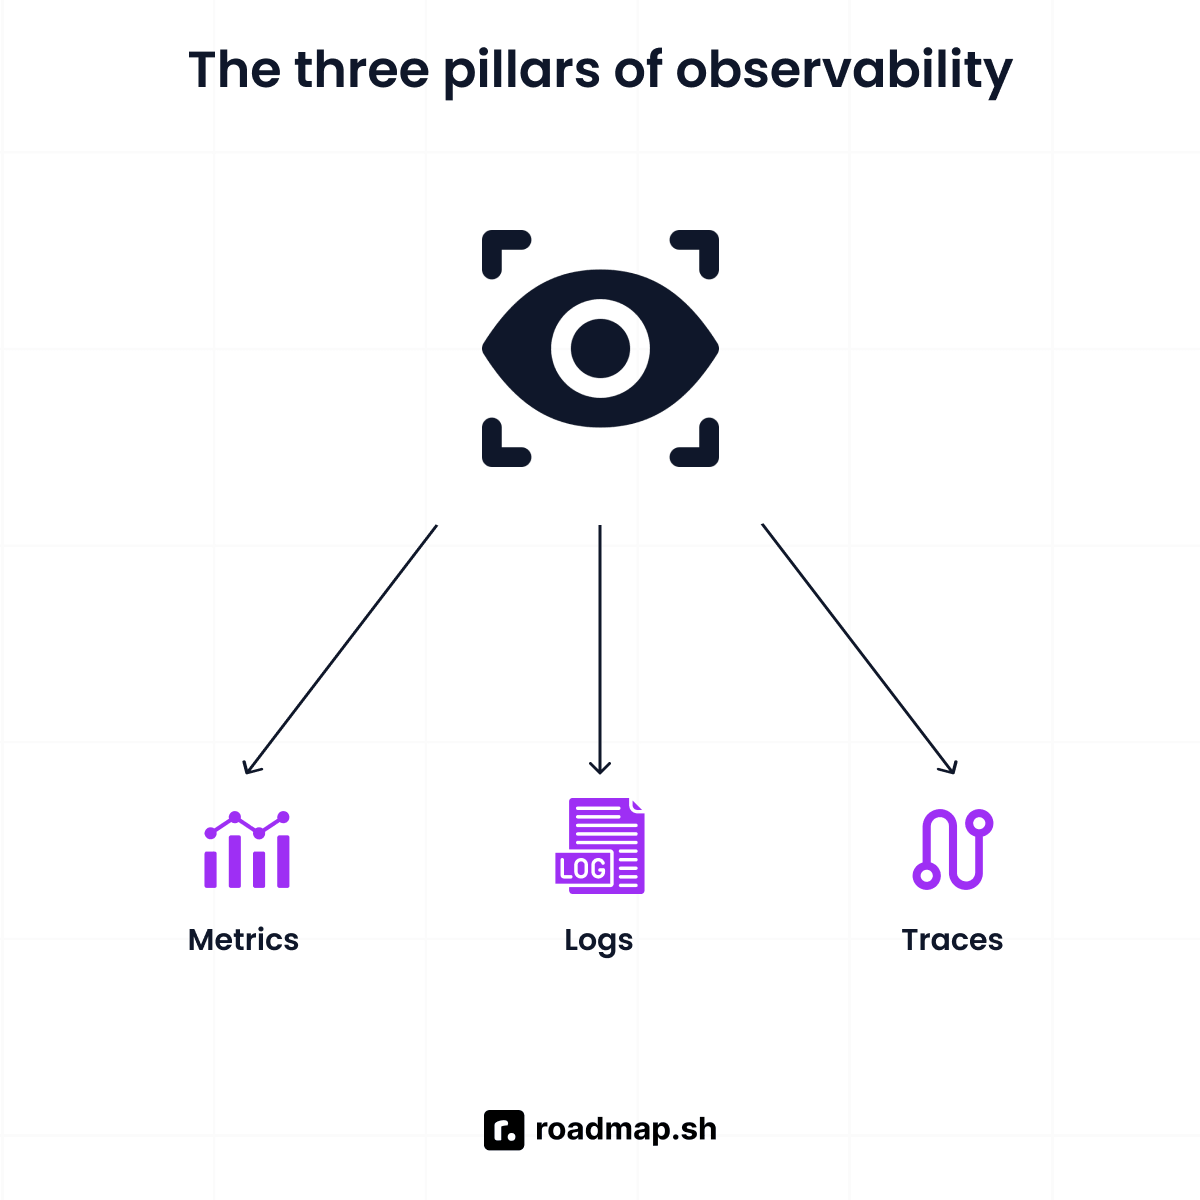
The following is a detailed explanation of the core components of AI observability:
Traces for AI workflows
A trace tracks every step involved in handling an AI request. Each step has a span that records its duration and relevant details. Spans can nest within one another to form a parent-child structure. The parent span covers the entire workflow, while child spans record individual operations.
For example, a company might use a RAG agent to answer customer questions about its refund policy. It passes the retrieved context to an LLM, which can call an external tool when needed. The agent then uses the results to generate its final response. A trace links these steps to a single request and shows how long each step took and where errors occurred.
When a response takes eight seconds, the trace shows which step took too long: retrieval, a model call, or a tool. It can also show failed tool calls and repeated model requests in the trace. If your instrumentation logs the retrieved documents, you’ll see them there too. This makes it easier to pinpoint the problem and fix the part of the workflow responsible for it.
Prompts and responses
Prompts and responses show what the model received and how it replied. They can reveal missing context, incorrect instructions, and unexpected or unsafe answers.
However, capturing prompts and responses can expose sensitive data in your telemetry. This data includes:
Personally identifiable information (PII)
Login credentials
API keys
Customer records
Limit access to data to those who need it, and update permissions as your team changes. Remove sensitive details before saving or sharing it, and delete the data after a set period. Run an OpenTelemetry Collector in your environment to filter sensitive data. Its redaction processor can hide values like credit card numbers and remove attributes not on an allowlist. Many libraries, including OpenTelemetry’s OpenAI package, leave content capture off by default. Enable it when you need to debug a problem, then turn it off when you're done.
Token usage, cost, and latency
Token usage, cost, and latency help you track AI resource use and find inefficiencies. Each metric measures a different aspect of an AI request:
Token usage measures the input and output tokens for each model call. Input tokens can include prompts, conversation history, retrieved documents, and tool results. Output tokens include the model’s response and, with some models, reasoning tokens.
Cost is usually based on the number of tokens used and the provider’s pricing. Rates vary by model, token type, and features like cached input. Spans can record model names and token usage without including a dollar amount. Observability tools like Langfuse and Datadog estimate the cost using the token counts and model pricing they have on file. If you’re using a custom or unsupported model, you can add its pricing in the observability tool. Or, you can calculate the cost in your app and send it along with the telemetry.
Latency measures how long each step takes, including model calls and document retrieval. With streaming, time to first token (TTFT) measures how long it takes for the model to start responding.
Track these metrics for every request and workflow, not just one or the other. This makes it easier to find costly prompts, slow steps, and agents that make too many model calls. It also helps you compare model costs and find workflows that use too many resources.
Agent and tool call signals
Agent observability helps you see how an agent completes a task and where it fails. Useful signals include which tools the agent calls, in what order, and with what inputs. They also include the results or errors that come back and how many model calls the agent makes. Tracking these signals helps you find repeated steps, failed tool calls, and loops that waste time and money.
For example, if an agent schedules a meeting at the wrong time, a trace can show what it sent to the calendar tool and what the tool returned. It also shows the tool's response, which helps you investigate the error. This helps you see whether the agent misunderstood the request, sent the wrong details, or misread the result. The same approach works for tools accessed through the Model Context Protocol (MCP).
Quality evaluations
Quality evaluations measure AI output quality with scores for relevance, groundedness, and safety. These scores help you assess whether responses meet your application's quality standards. You can evaluate its outputs in one of three ways:
Heuristics. Check outputs against rules, such as valid JSON, required fields, or citation presence. These checks are fast and consistent, but they can’t evaluate every part of an answer.
LLM-as-judge. Use another language model to evaluate an answer based on predefined criteria. It can handle complex responses, but its judgments may not always be reliable.
Human review. Use human reviewers to check the accuracy, relevance, and safety of AI outputs. They can find errors that automated tools miss, but reviewing many outputs takes time.
Add evaluation scores to traces so you can track output quality, cost, and latency. These scores can help you figure out why certain responses aren’t great. To save money, teams usually review a sample of production requests and test on evaluation datasets before major releases.
Open standards
OpenTelemetry’s GenAI semantic conventions standardize AI telemetry names so compatible tools can interpret and use the data consistently. They cover model calls, token usage, agent runs, retrieval, and tool execution, with attributes such as gen_ai.request.model and gen_ai.usage.input_tokens. This shared format makes it easier to connect telemetry across an AI application and send it to compatible observability backends.
As of October 2026, OpenTelemetry still considers these conventions experimental. On June 12, 2026, semantic conventions v1.42.0 moved them out of the main repo into a separate GenAI conventions repo, which hasn’t published a tagged release yet. Since attribute names and definitions may still change, pin your instrumentation versions and test updates before deploying.
How to get started with AI observability
You don’t need a large observability platform to get started with AI observability. Start with one AI workflow, trace its model calls, and send the traces to a backend you can inspect.
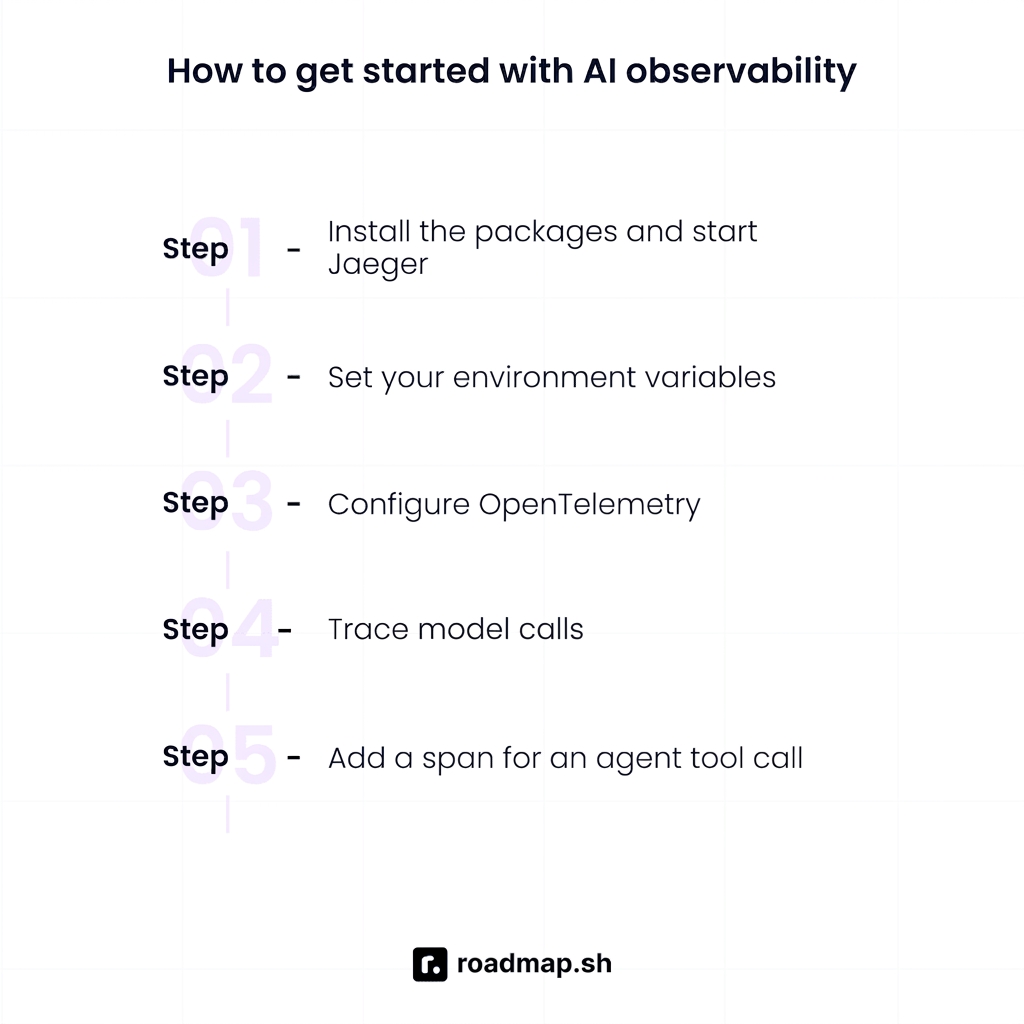
OpenTelemetry lets you instrument your application without tying it to a specific vendor. You can switch observability backends without rewriting your instrumentation. In the steps below, I use:
Python and the OpenAI SDK to send a request to an AI model.
OpenTelemetry to capture traces and Jaeger to inspect them. You'll also learn how to add custom spans to track an agent workflow and its tool calls.
You need Python 3.10 or later and Docker installed. I tested the code examples using a mock OpenAI server and a local OTLP receiver. Install the pinned versions and test the full setup in your environment before using it.
Step 1: Install the packages and start Jaeger
Set up a project folder and activate a virtual environment:
After creating the virtual environment, activate it before installing the required packages. The activation command varies by operating system.
macOS or Linux:
Windows PowerShell:
Install the pinned dependencies:
These pinned versions make the setup easier to reproduce. OpenTelemetry’s GenAI conventions are still under development. As a result, new releases may change attribute names or imports that your code depends on. Test the installation in a clean environment and fix any dependency issues before using this setup in practice.
Next, start Jaeger with Docker:
Once Jaeger is running, open http://localhost:16686 in your browser. It receives OTLP over HTTP on port 4318. Keep the container running so you can inspect the traces your app sends.
Step 2: Set your environment variables
Set your OpenAI API key and disable message-content capture. Use the commands for your operating system.
macOS or Linux:
Windows PowerShell:
Replace your-api-key with your actual OpenAI API key. The variable accepts NO_CONTENT, SPAN_ONLY, EVENT_ONLY, and SPAN_AND_EVENT. The default, NO_CONTENT, prevents this instrumentor from capturing message content. To inspect prompts and responses while you debug, set the variable to SPAN_ONLY. The OpenTelemetry instrumentation then records them in the gen_ai.input.messages and gen_ai.output.messages span attributes. Before capturing prompts and responses, review your redaction rules and access controls.
Step 3: Configure OpenTelemetry
Create an app.py file, then configure the tracer provider and OTLP exporter:
This configuration sets up OpenTelemetry tracing and sends trace data to Jaeger through its OTLP HTTP endpoint. It also enables automatic tracing for supported OpenAI operations, including chat completions.
Step 4: Trace a model call
Add the following code to the bottom of app.py, right after the configuration from Step 3:
Run the application:
Then inspect the trace in Jaeger:
Open Jaeger at
http://localhost:16686.Select the
support-agentservice.Open the trace and find the span for the
gpt-4o-minirequest.Check the span's attributes. You should see
gen_ai.operation.name,gen_ai.provider.name,gen_ai.request.model,gen_ai.response.model,gen_ai.usage.input_tokens, andgen_ai.usage.output_tokens.Check that the span contains no prompt text. In my test, it did not because I kept content capture disabled.
The exact attributes depend on the instrumentation version and the model's response. Verify them in your own trace before using them in dashboards or alerts. Jaeger shows these token counts but does not calculate their cost in dollars.
Step 5: Add a span for an agent tool call
Tracing a single model call is a good first step, but AI apps often do more before they answer. They retrieve documents, call APIs, run tools, and make several model requests.
Auto-instrumentation captures supported model calls. To trace your own tools and the full agent workflow, you need to create custom spans.
Add the code below to app.py, replacing the request and try/finally block from Step 4. Keep the imports and OpenTelemetry configuration from Step 3.
Run the application again:
Open the new trace in Jaeger. You should see invoke_agent support-agent as the parent span. The execute_tool lookup_order span and OpenAI model request should appear beneath it. If a span appears outside the parent, check that the operation runs inside the agent span's with block.
The same approach works for RAG. Create a custom span around your vector database search and set gen_ai.operation.name to retrieval. Record the number of results and, when useful, a limited set of document IDs and similarity scores. The span's duration shows how long the search takes. Since query and document text may contain sensitive information, it’s best to start with IDs, scores, and result counts instead.
The app.tool.order_id attribute shows how to add custom fields to spans. Avoid recording API keys, personal details, or other sensitive data. Also, check whether identifiers such as order IDs count as sensitive in your system.
What to add next:
Token cost tracking: Track token usage and estimate the cost based on the provider’s pricing.
Output quality: Rate a sample of responses based on relevance, correctness, groundedness, and safety.
Alerts: Monitor latency, costs, errors, and evaluation scores.
Version tracking: Record prompt and model versions so you can find issues after making changes.
What's the best AI observability tool?
The best tool depends on your AI stack, deployment needs, data policies, and budget. Use OpenTelemetry to collect telemetry without locking yourself into a specific vendor. Next, compare backends and evaluation features based on your requirements. For a more detailed breakdown, check out our article on the best LLM observability tools.
AI observability vs. related practices
These observability practices overlap, but track different signals and solve different problems. The table below compares what each practice monitors and the problems it solves:
Practice | What it watches | Typical signals | Example questions it answers |
|---|---|---|---|
Traditional observability | Infrastructure and application health | Uptime, error rate, latency, CPU, memory | Is the service up? Which endpoint returns errors? |
ML model monitoring | Predictive models in production | Feature drift, prediction distributions, accuracy | Did the input data change? Did the accuracy decrease? |
LLM observability | Individual model calls | Prompts, tokens, cost, latency, quality scores | Did the model make up a return policy? Which prompt version raised cost? |
Agent observability | Multi-step agent runs | Plans, tool calls, retrieval, execution order, loops | Which tool call failed? Why did the agent loop? |
Data observability | Tables and pipelines feeding AI | Freshness, volume, schema changes | Did the scheduled load run? Did a column change type? |
Traditional observability
Traditional observability monitors infrastructure and application health: uptime, errors, resource usage, and latency. It helps you identify and diagnose problems that affect system reliability. AI observability builds on these capabilities to track model calls and agent actions. If you want to learn more, see our DevOps monitoring tools guide and DevOps roadmap.
ML model monitoring
ML model monitoring tracks predictive models that classify, score, or forecast data. It helps you detect changes that could affect prediction accuracy as data changes. You can then use these signals to detect when changing conditions affect model performance. AI model observability covers both predictive models and generative AI systems.
LLM observability
LLM observability is a subset of AI observability that tracks individual model calls. It records prompts, responses, token usage, cost, latency, and output quality. These signals help you understand why an LLM produces poor results and how prompt changes affect performance and spending. To find a platform that tracks these signals, see our guide to LLM observability tools.
Agent observability
Agent observability tracks each step an AI agent takes, e.g., planning, data retrieval, and tool use. These traces help you investigate failures and understand unexpected agent behavior. Agent observability also helps you debug interactions with external tools through MCP servers.
Data observability
Data observability focuses on the health and quality of data entering an AI system. It tracks freshness, volume, schema changes, missing values, and other data quality signals. Bad or outdated data can produce wrong AI results, even if the model itself works fine. Data observability finds stale, missing, or changed data that feeds your AI system. AI observability traces what data reaches the model and what outputs it produces.
AI observability best practices
Good AI observability means collecting useful data, protecting sensitive information, and managing costs. The following are the best AI observability practices:
Instrument with an open standard and keep the backend swappable. With OpenTelemetry, you can switch vendors without rewriting your code.
Trace every step of an agent run, not just the input and output. Record model calls, retrieval, tool use, and retries to find the failing step.
Protect prompts and responses. When possible, leave content capture turned off by default. Hide sensitive data and personal details, limit access, and set clear retention periods.
Tag spans with the prompt and model version. This lets you compare how your app behaves before and after a change and trace quality drops to their cause.
Pin instrumentation versions. GenAI semantic conventions are still changing, so updates could impact your instrumentation. Before upgrading, test the new version for changes to attribute names or behavior.
Sample traces and evaluations with a plan. Choose a sampling rate that balances trace coverage with storage and evaluation costs. For high-risk paths or during an incident, increase coverage to capture more data.
Alert on cost and latency. Error alerts alone won't catch every AI problem. Set alerts for high costs, slow workflows, excess token use, and repeated model calls.
Review real traces regularly. Review a sample of production runs and compare poor answers with good ones. Use what you learn to improve prompts, retrieval, and tool handling.
The bottom line
AI observability adds prompts, tokens, and output quality to logs, metrics, and traces. It helps you understand how AI systems behave and identify performance issues. To track these issues, you need a way to collect and analyze AI telemetry.
OpenTelemetry provides a vendor-neutral way to collect AI telemetry. However, GenAI standards are still developing, so some conventions may change. Start by tracing one AI workflow and tracking its cost, latency, and output quality. Then add evaluations and alerts to help you find and fix problems in your AI system. With the right observability practices, you can fix issues faster and build AI applications that work better and cost less.
Explore the AI Engineer roadmap to learn more. You can also ask the AI Tutor questions about both to better understand them.
