12 Best Data Observability Tools: Pros, Cons and Pricing
 Ekene Eze
Many data teams take data observability seriously only when something forces the issue. Pipelines multiply, more people start working with the data, and an unexpected schema change breaks a dashboard or affects a model. By the time data downtime starts costing the business money or damaging its reputation, someone downstream may have found the problem before the data team did.
In this guide, I'll walk you through 12 data observability tools to consider for your team, from ML-driven platforms like Monte Carlo to open-source options like Soda and GX Core. Let's compare them at a glance, then look at what each tool does well and where it falls short.
If you want to build the skills behind these tools, follow the Data Engineer roadmap.
TL;DR: Best data observability tools at a glance
Tool | Type | Best suited for | Open-source option | Pricing model |
|---|---|---|---|---|
Monte Carlo | Managed platform | Automated anomaly detection, data lineage, and incident investigation across the data stack | No | Usage-based; contact sales |
Bigeye | Managed platform | Metric-based monitoring, data SLAs, and lineage | No | Contact sales |
Anomalo | Managed platform | Unsupervised machine-learning detection of unexpected data issues across tables | No | Contact sales |
Sifflet | Managed platform | Data observability, catalog, lineage, and impact analysis | No | Contact sales |
Acceldata | Managed platform | Data quality, pipeline performance, and infrastructure cost monitoring across cloud and on-premises environments | No | Contact sales |
Datadog Data Observability | Platform-native | Data quality and pipeline monitoring integrated with Datadog | No | Usage-based |
Soda | Open source | Data quality checks defined as code | Core only | Free; usage-based; contact sales |
Elementary | dbt-native | Monitoring dbt models using test results, metadata, and artifacts | Core only | Free; contact sales |
Great Expectations (GX Core) | Open source | Data validation using Python-based expectations in data pipelines | Yes | Free |
Datafold | Managed platform | Comparing datasets, validating migrations, and detecting data changes in CI/CD workflows | No | Contact sales |
IBM Databand | Pipeline-focused | Monitoring pipeline health, detecting incidents, and investigating pipeline failures | No | Usage-based |
OpenMetadata | Open source | Data discovery, lineage, quality tests, and observability in a metadata platform | Yes | Free; contact sales |
Types of data observability tools
Data observability tools differ in what they monitor and how they detect problems. Some use machine learning to identify unexpected changes, while others rely on checks defined by engineers. Some focus on dbt models and code changes, while others monitor entire data pipelines.
Which type fits depends on the problems you need to catch, your existing stack, and how much control you want over the rules. Team size and budget play a part too.
What data observability tools monitor
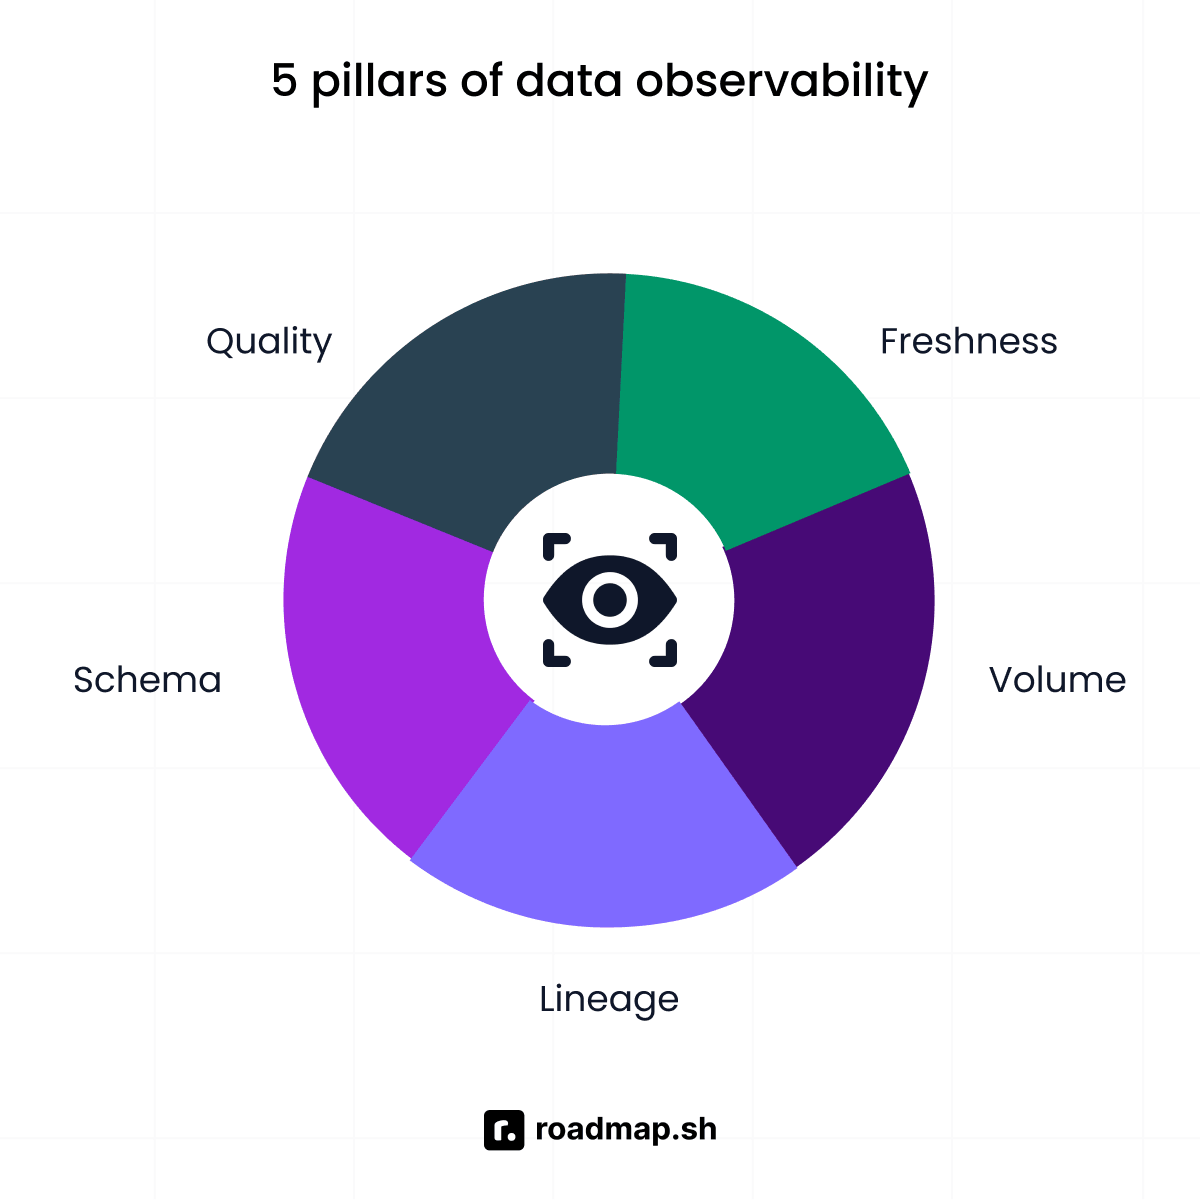
Barr Moses, CEO and co-founder of Monte Carlo, popularized a framework that describes data observability through five pillars: freshness, volume, schema, distribution, and lineage:
Freshness: Checks whether data is available when expected. A delayed pipeline can leave a dashboard showing yesterday's numbers when the business expects today's.
Data volume: Tracks the amount of data in a table or pipeline. A sudden drop in daily records could indicate a failed ingestion job or missing source data.
Schema drift: Detects changes to a table's structure, such as a renamed column or a changed data type, that could break downstream queries.
Data distribution: Monitors the values within a dataset. For example, a jump in nulls or an unexpected shift in customer ages.
Data lineage: Shows where data comes from and how it moves through downstream tables, models, and dashboards, so you can trace an issue to its source and see what it affects.
These pillars focus on the data inside tables. Acceldata uses its own five-pillar framework that widens the view to the systems and spend behind the data: data quality, pipelines, infrastructure, users, and cost.
ML-driven managed platforms
If your team manages hundreds of tables, writing checks for every possible issue becomes difficult. Tools like Monte Carlo, Bigeye, Anomalo, Sifflet, and Acceldata use machine learning for anomaly detection, identifying unexpected changes without requiring you to write a rule for every possible issue.
The trade-off is cost and control. These are commercial platforms, and you still need to investigate alerts to determine whether a change is a real problem or an expected variation.
Checks-as-code and open-source frameworks
Soda and Great Expectations (GX Core) let you define data quality checks and run them in your pipelines. These checks can verify that columns contain no null values, primary keys are unique, or tables meet expected record counts.
However, data quality testing and data observability address different problems. Data quality testing checks whether data meets defined conditions. Data observability detects issues, including unexpected changes.
A test can catch null values if a check exists for them. But if a pipeline suddenly produces fewer records than usual and no test covers that change, an observability tool may detect the anomaly.
Many teams use both. Tests protect known requirements, while observability detects unexpected changes.
dbt-native and developer workflow tools
dbt already supports data testing through dbt test and source freshness checks, allowing teams to validate defined requirements without another tool. Elementary uses dbt models, tests, and artifacts to help engineers identify issues in their transformations. Datafold uses data diffing to compare datasets and its CI/CD integration to catch unexpected changes before code is merged or transformations are deployed.
These tools extend the development workflow with monitoring and change detection, keeping checks alongside code in version control.
Platform-native and pipeline-focused tools
Some tools build data observability into a broader platform. Others focus on pipeline execution, jobs, and orchestration.
Datadog Data Observability brings data monitoring into the Datadog ecosystem, allowing you to investigate data issues alongside other operational signals. IBM watsonx.data integration focuses on pipeline health to detect and investigate failures in data jobs.
However, OpenMetadata combines data discovery and data lineage, quality checks, and observability in an open-source platform. Sifflet also combines observability with data catalog capabilities. If you need data governance, search, and access control alongside monitoring, these tools offer more than platforms focused primarily on detecting data quality issues.
12 best data observability tools
Let me take you through each tool, covering what it does well, where it falls short, who it suits, and what it costs, so you can match one to your team.
1. Monte Carlo
Monte Carlo (known as the category pioneer) uses machine learning to detect anomalies in freshness, volume, schema, and distribution. You don’t have to write a rule for every possible issue.
Its field-level lineage shows how individual columns flow through tables and downstream assets. When something breaks, incident triage and root-cause analysis help you trace the problem to its source and see which dashboards, models, or data products are affected.
It integrates with data warehouses, BI tools, ETL platforms, and orchestration tools. Monte Carlo now also covers AI agent observability. It monitors agents alongside the data they depend on.
Pros
Broad integrations: Coverage spans warehouses, BI tools, ETL, and orchestration, so you can trace an issue across systems.
Minimal setup: It connects through read-only credentials, and automated monitors start without hand-written rules.
Cons
Premium pricing aimed at enterprises: Cost is credit-based, so it rises as you add monitors. Estimate your usage before you commit.
Less control than code-first tools: Monte Carlo supports monitors-as-code, but its emphasis is automated monitoring. If you want checks defined mainly in code, Soda or GX Core fit better.
Best suited for
Large data teams with many sources and business-critical data products.
Pricing
Monte Carlo uses usage-based pricing. You buy credits, and monitors consume them at published consumption rates. The cost per credit depends on your tier: Start, Scale, Enterprise, or Business Critical. Request pricing from Monte Carlo for your setup.
2. Bigeye
Bigeye uses machine learning to detect data quality issues. Its Autometrics feature recommends monitors for the columns that feed your data products. Monitoring is metric-based, with more than 70 built-in checks, and you can add custom checks on top.
You can also set data SLAs for data quality and freshness. Column-level lineage traces data across pipelines and downstream assets.
Pros
Granular metric-level control: Custom checks let you monitor against your own data quality requirements.
Automated monitoring: Monitor recommendations and anomaly detection cut down the checks you write by hand.
Fit for SLA-driven teams: Data SLAs set a target for quality and freshness, and lineage helps you trace a miss back to its source.
Cons
More setup for custom checks: Autometrics gets you started faster, but custom checks, such as multi-column checks and business metrics, take more configuration.
Cost: Pricing is quote-based, and Marketplace packages cap the number of monitored tables, so plan for growth.
Best suited for
Data teams that manage data against SLAs at warehouse scale.
Pricing
Bigeye doesn’t publish pricing on its own site. As of October 2026, its AWS Marketplace listing shows 12-month contracts at $45,000 for 100 active monitored tables and $75,000 for 300 tables. Bigeye says custom pricing goes through a private offer, so contact Bigeye for a quote.
3. Anomalo
Anomalo uses unsupervised machine learning to detect unusual patterns in data values. You don’t have to write a rule for every possible issue, and you can still add custom checks and metrics through a no-code interface or an API.
It monitors structured data and extends to unstructured data, including documents. When something breaks, automated root-cause analysis and lineage help you investigate and find the affected assets.
Pros
Low rule-writing burden: Machine learning detects unexpected changes, so you don’t define every check by hand.
Deep data-level checks: It examines patterns in data values, not only table freshness or row counts.
Built for large data estates: Bulk configuration lets you set up many tables at once.
Cons
Quote-based pricing: Anomalo doesn’t publish pricing on its website, so you can’t compare cost before talking to sales.
Baseline period: Anomalo says its models need about two weeks to produce useful results.
Best suited for: Enterprises that want automated data quality detection across many tables without writing rules for every possible issue.
Pricing: Anomalo doesn’t publish pricing on its website. Contact Anomalo for a quote.
4. Sifflet
Sifflet combines data quality monitoring, lineage, and a data catalog in one platform. It detects anomalies across your pipelines and ties each alert to metadata, ownership, and downstream impact, so you can see which assets are affected.
Pros
Monitoring inside the catalog: Health signals, ownership, and lineage sit next to each asset, so you can see what a dataset means and whether to trust it.
An alternative to Monte Carlo: Sifflet compares itself to Monte Carlo on business context and root-cause analysis. Compare quotes before you decide which costs less.
Cons
No published prices: You can’t compare costs on its website before asking for a quote.
Newer entrant: Sifflet was founded in 2021, so it’s newer than the category pioneers. It lists about 30 integrations, so check that your stack is on the list before you commit.
Best suited for: Suitable for businesses where analysts share responsibility for data quality.
Pricing: Sifflet pricing wasn't listed on their website. Its plans are tiered by the number of assets you monitor, from up to 500 on Entry to 1,000+ on Enterprise. Ask Sifflet what your asset count would cost.
5. Acceldata
Acceldata monitors data quality, pipeline health, and infrastructure performance across cloud and on-premises environments. It detects data anomalies, tracks lineage, and helps teams investigate pipeline failures.
It also monitors cloud data platform costs, including query performance and resource usage. Which gives you visibility into data reliability and the infrastructure costs behind it.
Pros
Broad monitoring scope: You can investigate data quality, pipeline failures, infrastructure performance, and spending within one platform.
Hybrid environment support: Acceldata supports data stacks running across cloud and on-premises environments.
Cost visibility: Cost monitoring helps teams identify inefficient queries, resource usage, and unexpected spending.
Cons
May be more than smaller teams need: Its broad infrastructure and cost-monitoring features are most useful for teams managing complex data platforms.
Pricing requires a sales conversation: The main data observability plans require contacting sales, making direct cost comparisons difficult.
Best suited for: Engineers managing large or hybrid data platforms who want to monitor data quality, pipeline performance, and infrastructure costs.
Pricing: Acceldata offers Pro and Enterprise plans for data observability. Pricing is available on request. Separate cost-optimization plans are also available, including a free trial.
6. Datadog Data Observability (formerly Metaplane)
Datadog acquired Metaplane in April 2025, bringing Metaplane’s machine learning-powered data quality monitoring and column-level lineage into Datadog Data Observability. The lineage traces how columns move from source systems to downstream tables and dashboards.
Datadog also offers Jobs Monitoring for pipeline failures and long-running jobs, and Data Streams Monitoring for tracking data streams across services.
Pros
Connects data and application monitoring: If you already use Datadog, you can investigate data issues alongside infrastructure and application performance.
Fits existing workflows: If you're already using Datadog, investigate data issues alongside infrastructure, application, and pipeline signals instead of managing a separate monitoring environment.
Cons
Pricing complexity: Quality Monitoring bills per monitored table, and each
Custom SQLmonitor counts as one too. Jobs Monitoring has separate rates for orchestrators and clusters, so your bill depends on what you monitor.
Best suited for: It is best if you already use Datadog for infrastructure monitoring, APM, and you want data quality and pipeline health in the same platform.
Pricing: Datadog lists Quality Monitoring at $16 per monitored table per month on annual billing, or $24 on demand. Jobs Monitoring for orchestrators such as Airflow and dbt costs $0.10 per job per hour. Datadog includes Data Streams Monitoring in APM Pro and APM Enterprise. You can also add it to Infrastructure Monitoring Pro and Enterprise hosts from $15 per host per month with an annual commitment.
7. Soda
Soda monitors data quality using checks and data contracts. Soda Core is its open-source library, while Soda Cloud adds monitoring, anomaly detection, and collaboration features.
Soda v4 uses YAML-based data contracts. In v3, you define checks using SodaCL. Both let you set data quality requirements and run them in your pipelines or CI/CD workflows.
Pros
Checks as code: Define data quality rules in version-controlled YAML files, and write custom checks in
SQLwhen the built-in ones don’t fit.Free starting point: Soda offers a free plan, and Soda Core lets you run checks in your own environment. In v4, you can publish the same contracts to Soda Cloud later, so you don’t rewrite them.
Cons
You manage the setup: Running Soda Core yourself means managing its environment and orchestration.
Explicit checks have limits: Checks only catch the conditions you define, although Soda Cloud also offers anomaly detection.
Best suited for: Data engineer who wants to define data quality checks as code and run them in their pipelines.
Pricing
Soda lists a Free plan at $0 per month and a Team plan at $750 per month. Team adds pay-as-you-go billing for additional Soda Processing Units (SPUs). Enterprise is custom priced, so you’ll need to book a demo to get a number.
8. Elementary
Elementary monitors dbt models using test results, metadata, and dbt artifacts. It tracks freshness, volume, and schema changes to detect data quality issues before they affect downstream assets.
The open-source dbt package provides core monitoring for dbt projects. Elementary Cloud adds ML-powered anomaly detection, column-level lineage, and additional monitoring features.
Pros
Fits your dbt workflow: Uses your existing dbt project and test results to monitor data quality.
No data duplication: Uses dbt artifacts and warehouse metadata without copying your data.
Cons
Requires dbt: If your transformations don’t use dbt, the package won’t fit your workflow.
Open source is limited: One project and table-level lineage only. Multiple projects and column-level lineage need Cloud.
No published Cloud prices: Elementary doesn’t list standard prices for its paid plans.
Best suited for
Analytics engineering in dbt, where you want data quality monitoring tied to your models, tests, and development workflow.
Pricing
Elementary’s open-source package is free. Elementary offers Scale, Enterprise, and Unlimited Cloud plans, priced by seats, environments, and monitored tables. Prices aren’t published, but there's a 30-day free trial.
9. Great Expectations (GX core)
GX Core is an open-source Python framework. You write an expectation for each rule that describes what good data looks like, then run data validation inside your pipelines. It works with Snowflake, BigQuery, Databricks SQL, Redshift, and Spark, and it publishes the results as Data Docs. It runs as a task in an Airflow DAG or any orchestrator that executes Python.
Pros
Free and open source: Apache 2.0, with no license fees for production use.
Full control: You decide which checks run and where, so quality logic stays next to your pipeline code.
Established framework: One of the industry’s most widely used open source data quality frameworks.
Cons
Setup and maintenance effort: You write the expectation suites and maintain the validation tasks yourself.
Validation not automated observability: GX Core validates rules you define rather than automatically detecting every unexpected change.
Best suited for
Teams that want to write data quality rules in Python and run them inside their own pipelines.
Pricing
It is free.
10. Datafold
Datafold compares tables value by value. Its data diff runs in CI and shows how a code change affects your data before it reaches production. It also offers column-level lineage, anomaly detection, custom SQL metrics, and data quality tests.
Pros
Checks in pull requests: You catch unexpected changes in the pull request before you merge (shift left).
Strong for migrations: You can line up source and target datasets and see which rows or values don't match.
Cons
Narrower monitoring scope: It's strongest at catching changes caused by code. For continuous production monitoring, a full observability platform covers more.
Best suited for
If you want to catch a regression in code review, validate migrations, and see how transformation changes affect downstream tables.
Pricing
Datafold uses custom pricing based on users and monitored tables. Ask their team to price your setup.
11. IBM Databand
IBM now offers Databand’s observability through it watsonx.data integration. It monitors pipeline health and each job run. You set alerts on run durations, data quality deviations, and input and output counts, and it keeps failure histories and pipeline dependencies so you can trace an incident to its source.
IBM lists integrations for Airflow (including Amazon MWAA), dbt Core and Cloud, Spark, Databricks, Snowflake, and Azure Data Factory.
Pros
One view of your pipelines: Databand centralizes pipeline metadata, logs, and statuses across your Airflow environments.
Fits IBM stacks: It can monitor Spark pipelines and datasets on IBM watsonx.data.
Cons
Less table-level depth: It goes less deep into the data inside tables than the ML-driven platforms.
Best suited for
Teams whose biggest problem is failed or delayed pipeline runs and who need to see what happened in orchestration and why.
Pricing
IBM offers a free 30-day trial. Production pricing is measured in Resource Units, with SaaS and self-managed options. IBM doesn't publish a rate, so use its price estimator or request a quote.
12. OpenMetadata
OpenMetadata is an open-source metadata platform licensed under Apache 2.0. It combines data discovery, column-level lineage, and a catalog with no-code data quality tests, a data profiler, alerts, and incident management. Collate, the company behind it, offers a managed version.
OpenMetadata lists more than 130 connectors, including Snowflake, BigQuery, Databricks, Redshift, dbt, and Airflow.
Pros
Free and self-hosted: You can run the core platform on your own infrastructure.
Catalog, lineage, and quality together: You see what a dataset is, where it came from, and whether its tests pass in one place.
Cons
You operate it: Self-hosting means running, upgrading, and scaling the platform and its ingestion.
Best suited for
Teams that want an open-source catalog with built-in quality and lineage.
Pricing
Self-hosted OpenMetadata is free. Collate's managed version has a free tier, and paid plans are priced through sales.
How to choose a data observability tool
Feature lists across these tools overlap heavily. What separates them is how your team works and where your problems show up:
Automation vs. control: Do you want the tool to find issues you didn't anticipate, or to enforce checks you define? ML-driven platforms do the first. Checks-as-code tools do the second.
Team size and budget: Smaller teams often start open source and add a managed platform as data products grow. Weigh license cost against the engineering time spent maintaining checks: that's the real total cost of ownership.
Stack fit: dbt teams can keep monitoring in dbt. Datadog shops have a shorter path to data monitoring there. Snowflake and Databricks offer native checks for basic freshness and quality. If your data contains sensitive information, check what data the tool accesses and whether it leaves your environment.
Warehouse compute: Most table-level monitors run queries against your warehouse. Check how often they run and whose compute bill they land on, since that cost sits outside the vendor's price.
Where problems appear: Bad values in tables call for data observability. Failed or late jobs call for pipeline monitoring. Breakages from code changes call for CI diffing.
Open-source exit risk: Check what happens to your workflows if a vendor changes its commercial offering. Great Expectations is one example: FICO announced plans to acquire GX Cloud, which stopped being publicly available in June 2026, while Fivetran took stewardship of GX Core. Keeping checks in code and YAML can make migration easier, but it doesn't eliminate vendor lock-in.
Which data observability platform should you use?
Honestly, the best data observability platform is the one that matches where your data breaks: ML-driven tools for unexpected issues, checks-as-code for known rules, and dbt or CI tools for code changes. Start with the situation that sounds most like yours.
Scenario | Recommended Approach |
|---|---|
Catch issues you didn’t anticipate | Monte Carlo, Anomalo, or Bigeye |
Team writes checks as code | Soda or GX Core |
Transformations run in dbt | Elementary + Datafold |
Already use Datadog | Datadog Data Observability |
Shared ownership (Analysts/Business) | Sifflet or OpenMetadata |
Main pain is failed pipeline runs | IBM Databand |
Hybrid platform / Cost visibility | Acceldata |
Small team on a budget | Soda Core, Elementary, GX Core, or OpenMetadata |
Next steps
Choosing a data observability tool is only one part of building reliable data pipelines. You also need to understand how data moves through your systems, how to validate it, and how to investigate failures when they occur.
To build the skills these tools assume, follow the Data Engineer roadmap. When you want to go deeper on any concept along the way, the AI Tutor can walk you through it.
