What Does a Data Analyst Do?

 William Imoh
A data analyst collects, organizes, and interprets data to help companies make informed decisions. At its core, the data analyst's role is to turn raw data into actionable insights.
It usually starts with asking the right business questions, like why there’s a sudden spike in customer engagement or which product category performs best. Analysts then gather data from various sources, clean it to remove errors, and analyze it using tools such as Excel, SQL, or Python. They present their findings in dashboards or charts to clearly communicate insights to stakeholders.
Imagine you're working with an e-commerce team. Sales suddenly decline, and no one knows why. As a data analyst, your job will be to analyze customer behavior data, identify patterns, spot trends like abandoned carts or failed mobile payments, and report back the root cause. Thus, helping the business fix the problem and recover lost revenue.
Before choosing it as a career, you should ask an important question: What does a data analyst do? The data analyst roadmap breaks down the skills and tools typically required to enter and grow in this field and provides clarity on how much coding experience is required.
TL;DR
Data analysts take raw data and transform it into clear insights, enabling businesses to make informed decisions.
To be good at this, you need a mix of technical skills (e.g., SQL, Excel, or Python) and communication skills to explain the findings to others.
From marketing to healthcare, companies in all industries need data analysts, and there’s a whole range of roles from entry-level to leadership in analytics.
Day-to-day tasks of a data analyst
As a data analyst, your daily tasks may involve retrieving, gathering, and interpreting data. In addition, you will identify patterns and transform the interpreted data into insightful reports for team members and clients.
People often think an analyst’s role is to work independently with spreadsheets all over their desk; however, this is not true. As a data analyst, you must collaborate with various departments within your organization, including data architects and database developers.
As a data analyst, some of your daily work routines will include:
Querying data: You'll often start your day by writing and running SQL queries, which involve extracting data from company databases and answering specific business questions. For example, you might have to pull user activity logs to analyze how people interact with a product or how sales changed after a new campaign.
Cleaning and preparing data: Before analyzing data, you must remove duplicate information, fix formatting issues, and validate sources. Apart from extracting data, your role will also include cleaning customer data collected from primary and secondary sources for better analysis.
Analyzing trends and patterns: Once you have prepared the data, you will dive into the analysis. In this process, your tasks will include running statistical tests, segmenting users, identifying trends, and tracking changes over time.
Building reports and dashboards: You’ll use tools like Excel, Power BI, or Tableau to build dashboards and reports with key metrics. These valuable insights and visualizations will enable key stakeholders to get a quick update on trends.
Communicating insights: Data analysts do not work independently; you will be communicating and collaborating with different departments, product managers, marketing leads, finance teams, or executives. You will also explain the data and discuss how the organization should strategize for its next move during meetings with stakeholders.
Monitoring and maintenance: You will be responsible for tracking performance metrics, KPIs, and dashboards to confirm they’re accurate and up-to-date. This often involves setting up automated alerts or scheduling reports to provide regular updates, helping teams stay informed and take timely action.
Keep in mind that all these tasks and responsibilities of data analysts may vary depending on the company, industry, and team structure. Now that you know what data analysts do daily, you may wonder how they accomplish their tasks. Let's look at the tools they commonly use to perform the job.
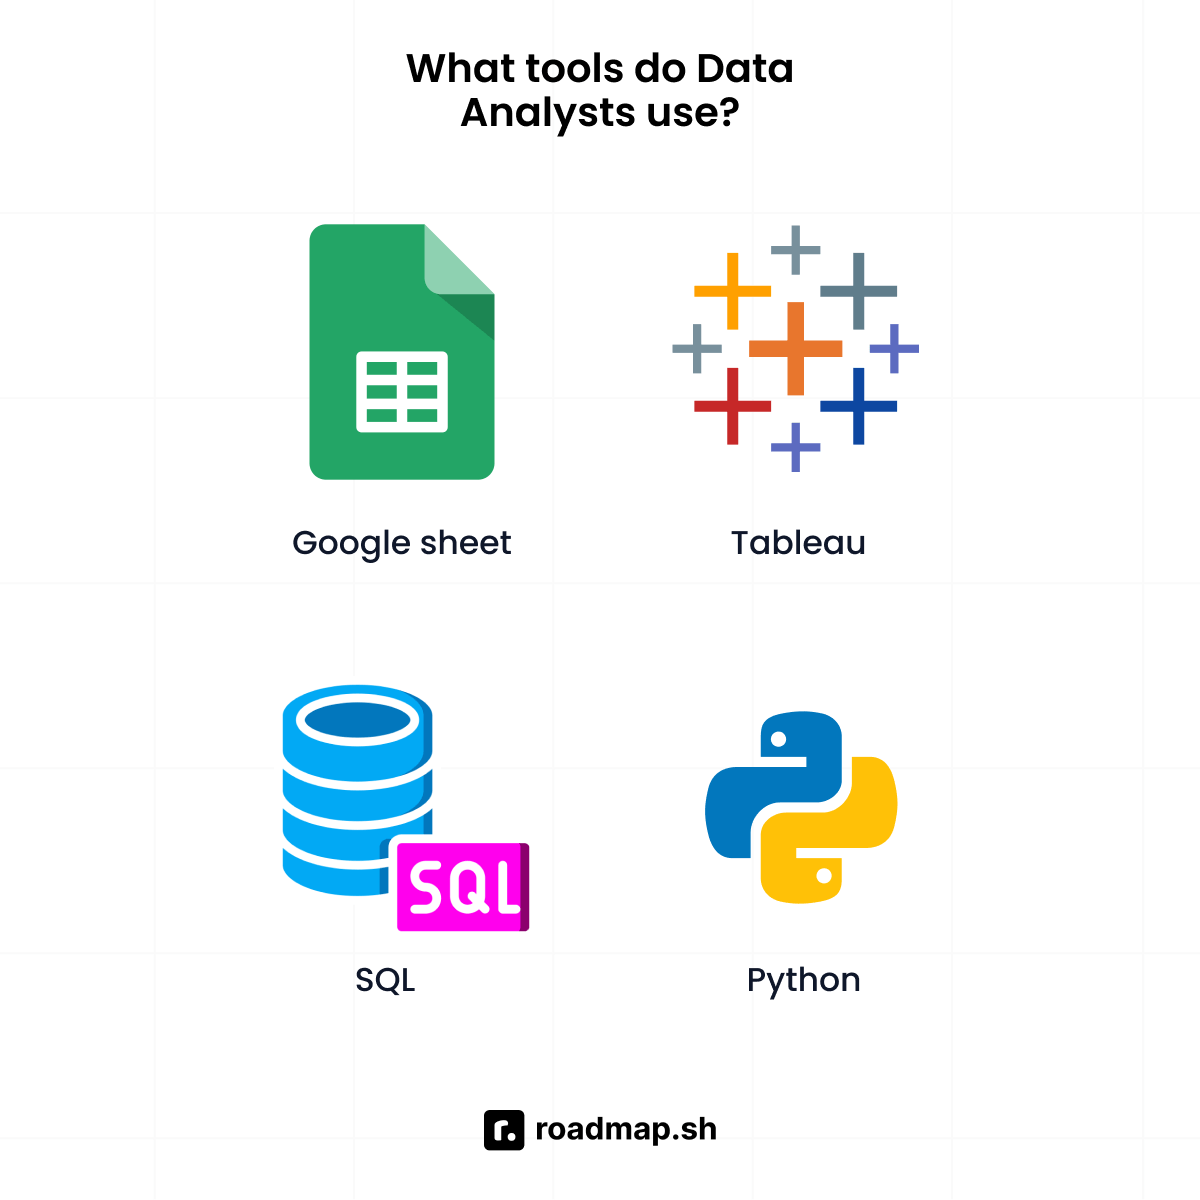
What tools do data analysts use?
Data analysts use a combination of tools to collect, clean, analyze, and visualize data based on the project's goals and scale.
Different tasks require different tools; no two analysts use the same tool stack. Some data analysts work on spreadsheets while others rely on SQL. Some even combine multiple tools, depending on the project requirements.
Before diving into the standard tools used in data analysis, it's helpful to know that you don’t need to learn everything at once. You should begin with Excel and SQL, and pick up other tools as their role grows.
Let’s take a closer look at the most common tools data analysts use:
Excel and Google Sheets: Spreadsheets are the basic tools that people mostly start their journey as data analysts. They are good for data exploration, basic cleaning, pivot tables, and charts.
SQL: SQL is foundational, and almost every analyst role expects you to know how to query databases. Whether you are filtering user activity or joining tables to build a report, SQL is how you get the raw data you need. You can join our Master SQL course for more guidance or check our SQL roadmap.
Data visualization tools: Power BI, Tableau, and Looker are some of the most commonly used tools that analysts rely on for manipulating data in different visualization types. Each offers a unique approach to visual analytics. For instance, Power BI is known for its seamless integration with Excel, Azure, and other Microsoft products. Furthermore, its data modeling capabilities and interactive dashboards make it a suitable option.
Python (optional but helpful): Python, a popular programming language widely used for data analysis and software development. Whether you are cleaning data, running statistical tests, or visualizing trends, using Python will help streamline the whole process. The tool is best known for its robust libraries, like Pandas for data manipulation and NumPy for numerical computing.
R (optional but helpful): Another open source programming language that analysts use for statistical analysis and data visualization. It allows users to handle some of the complex statistical computations with ease. It’s not only about numbers, but also best used for data manipulation and other practices.
In addition to knowledge of these tools, you must also have the right skills to succeed as a data analyst.
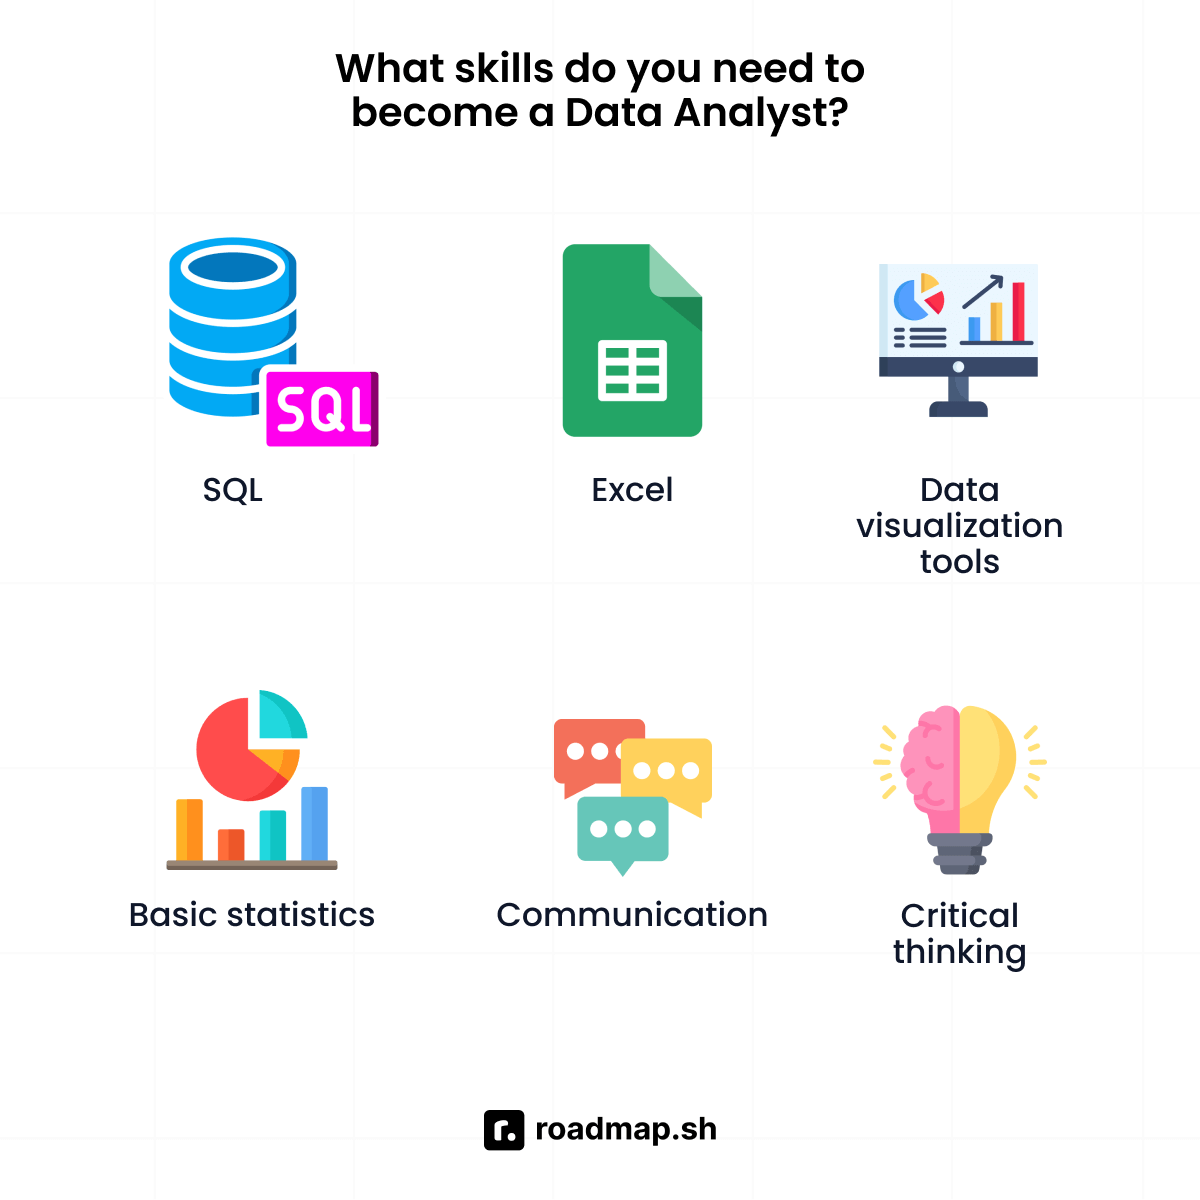
What skills do you need to become a data analyst?
A data analyst needs technical and soft skills to turn data into insights and communicate with stakeholders.
You don’t need to be a math genius or master coder to navigate the interview or analyst journey. Though some professionals believe that advanced math or deep ML skills are a must-have for data analysts, most analysts don’t actually need these skills. Instead, focus on improving your technical and soft skills to excel in this field.
Starting with technical skills, let’s expand on some of the tools you’ll need to master as a data analyst.
SQL (Structured Query Language)
SQL is one of the most essential tools for any data analyst. It helps to pull, filter, and join data from large databases. Imagine you are provided access to hundreds of records and need quick answers to questions like, "Who signed up in the last 15 days and made a purchase?" With good knowledge of SQL, you can easily pull data and provide relevant answers.
Our structured SQL course can take you from beginner to advanced skills in querying databases.
Excel
Excel remains the go-to for many analysts. From small companies to startups, many analysts rely on Excel for quick calculations, building pivot tables, summarizing data, and doing ad hoc analysis. Also, many stakeholders and team members are familiar with Excel, making it important for smooth communication.
Data visualization tools
Data visualization tools, such as Tableau, Power BI, and Looker, are common tools used by professionals to transform complex data into easy-to-understand visuals. These tools provide interactive dashboards, charts, and graphs to explain the insights behind the numbers, making it easier for team members and stakeholders to compare data and make informed decisions.
Whether identifying sales trends, monitoring website traffic, or evaluating campaign performance, visualizations help convey insights fast and clearly. Mastering them will help analysts not just analyze data but also tell compelling facts with it.
Basic statistics
A strong understanding of basic statistics is important for accurately interpreting data. You’ll need to understand concepts like averages, medians, standard deviation, correlation, and probability to help analyze and make sense of data in a meaningful way.
Statistical knowledge helps you to ask better questions, analyze data points, and avoid incorrect assumptions. For example, if a company experiences an increase in revenue, statistics can help determine whether it’s a seasonal trend, marketing efforts, or random variation.
Apart from technical skills, excelling in a few soft skills will make a real difference:
Communication
If you think you are an expert in the above-mentioned technical skills, you are only halfway there. Analysis is only half the data analyst job; explaining it clearly to your clients and team members is just as important. Effective communication skills help analysts to present insights to clients who may not have a technical background.
Whether you're writing a report, giving a presentation, or building a dashboard, your ability to convey the meaning of data in simple terms is key. Your job as a data analyst is to collect data, share numbers, calculate data, transform it, and explain its meaning to help the organization make better decisions.
Critical thinking
Critical thinking is what separates you from the rest. This skill involves questioning the data, exploring unexpected trends, and connecting the dots between insights and business objectives. You can’t rely solely on data to clearly present anomalies or hidden variables.
You must have analytical skills and the ability to investigate what, why, and how it's happening. This might involve comparing periods, segmenting customer groups, or identifying relationships. To excel in this, you must be a good critical thinker.
Attention to detail
Even a minor error in data analysis can lead to suboptimal decisions. Hence, you must be meticulous when cleaning, preparing, and analyzing data. Double-checking formulas, validating data sources, and thoroughly reviewing dashboards before presenting them are all part of the job. Being detail-oriented ensures accuracy and prevents costly errors.
If you already have experience working with spreadsheets and enjoy breaking down why things happen, you’re probably closer to a data analyst skillset than you think. Still, one question often stirs debate among beginners and professionals alike.
Do data analysts need to code?
Data analysts don’t need to be expert coders, but they need to have some basic knowledge. As a data analyst, you won’t be writing complex code every single day. However, it’s still important to know the basics, especially in SQL, since you’ll often need them to pull data or answer business questions.
Nearly every analyst role involves querying databases. It’s not that difficult to learn. Once you gain clarity on how to use SQL, it becomes much easier to tackle other tasks. If you're looking to build a solid foundation in SQL, the Master SQL course by Roadmap is a great place to start.
Python or R is helpful but not mandatory. Python is good for automating repetitive tasks, cleaning data, and performing more advanced analysis. Some jobs might require it, but many entry-level roles are fine with just SQL and Excel.
Tools like Excel, Tableau, and Google Sheets can take you far without writing code. Coding can be scary, but in the case of data analysis, it’s like the icing on the cake. You may be fine without it, but some knowledge of coding can take things to the next level.
Is being a data analyst stressful?
The stress level of a data analyst depends mainly on the work environment, team expectations, and company culture.
Most of the time, data analysis offers a good balance between independent work and team collaboration. As a result, you’ll have space to dive deep into the numbers while working with teams to share what you find.
That said, there can be pressure, especially if:
Your insights are directly tied to company revenue or product performance
You’re expected to deliver results on short deadlines
You’re the only analyst supporting a large team or department
But it’s not typically the same high-pressure stress that you might expect in jobs like investment banking or technical support. As long as your team values data (and gives you access to good tools), it’s a manageable and often very fulfilling role.
Did you know there are different data analyst roles to choose from? In the data analytics world, certain roles cater to different departments and organizational requirements. Let's learn about these in detail.
What are the different types of data analysts?
If you are an aspiring data analyst, here are a few different positions you can consider for your career.
Business Intelligence (BI) analyst
A business intelligence analyst delivers valuable business insights that play a key role in implementing strategic decisions. This role focuses primarily on building and maintaining dashboards, tracking key performance indicators (KPIs), and generating insightful reports for team members.
BI Analysts often collaborate with multiple departments to provide a complete business performance overview and identify growth trends.
The data professionals generally rely on tools like SQL, Tableau, or Power BI for insightful reporting. If you are interested in analyzing larger data sets and influencing high-level business strategies through data, this data analyst role might be perfect for you.
Marketing analyst
Marketing analysts focus on customer behavior, advertising performance, and campaign effectiveness. They collaborate extensively with marketing and growth teams to help them understand who the customers are, how they interact with the brand, and which campaigns will generate higher return on investment (ROI).
A market research analyst's role is to gather data from surveys, websites, clean, sort, and review marketing campaign results and conversion rates to help organizations make better business decisions.
These data analysts generally use Google Analytics, Meta Ads Manager, and SQL to track and report on digital campaign status. If you are someone who understands customer psychology and is interested in analyzing campaigns and customer data, you might find a marketing analyst job profile to be a good option.
Product analyst
Product analysts work on user behavior analysis, feature adoption, retention rates, digital marketing campaigns, and measuring A/B test results to help team members make better decisions about their products.
To succeed in this role, you must know the right tools and a solid understanding of product usage metrics and user journey. Mostly, product analysts use SQL and dashboard tools to track product and user engagement. They also interpret data sets and suggest improvements.
If you enjoy building better user experiences and recommending ways to uplift product engagement and performance through data, this profile can be a good choice.
Operations analyst
Operations analysts focus on improving the efficiency of internal business processes. Their work involves analyzing supply chains, workflows, resource allocation, and process bottlenecks. Their main goal is to help streamline operations and reduce costs while maintaining quality and productivity.
These data analysts often work with operations managers and logistics teams, using data to model scenarios, forecast future outcomes, and enhance overall efficiency. Tools like Excel, SQL, and sometimes Python or R are common in this role. It's ideal for those who enjoy optimization, logistics, and solving practical business problems.
Despite different focuses, all these data analyst roles share a common skillset, i.e., work on SQL, Excel, data visualization tools, and master communication skills to explain findings to stakeholders. Next, let’s discover data analyst career outlooks and their salary packages.
Data analyst career and job outlook
Based on your skills and experience, you can apply for different job levels in data analytics:
1. Entry-level: Data analyst
As an entry-level data analyst, i.e., a beginner, you'll collect, clean, and present data to help teams make smarter decisions. You’ll build dashboards, generate reports, and use various analytical and data visualization software to gain insights. At this stage, having strong data visualization skills, knowledge of basic data analysis functions, and SQL is key.
In the US, entry-level data analyst salaries have risen in recent years, with the average around $90,000 per year.
2. Mid-level: Senior data analyst
When you get to the stage of a senior data analyst, your workload will increase. It will go beyond mere routine reporting to identifying patterns and strategic decisions. You'll also be in the position to mentor entry-level analysts, work closely with product or business teams, and generate actionable insights. At this level, experience with Python, A/B testing, and cross-functional collaboration becomes important.
In the US, as a senior data analyst, you might earn between $69,720 and $146,962 per year, depending on industry and location.
3. Advanced: Analytics manager / Strategy lead
Being an analytics manager or strategy lead, your tasks will include overseeing a team of analysts, managing data projects, performing predictive analysis, and helping shape business or product strategy through data. From translating complex findings into business recommendations to influencing decision-making across departments, you will be handling some major tasks. Strong leadership, communication, and stakeholder management are essential skills.
In the US, you might typically earn between $77,251 and $184,230 per year. As you grow, you can branch into specialized paths like Business Intelligence (BI), Product Analytics, and Data Science. If you're interested in data science or want to become a data scientist, start by looking at our data science roadmap.
Wrapping up
Getting started with a data analytics career is doable, even if you’re switching careers. Just follow a simple approach, i.e., learn SQL and Excel and do regular practice with public datasets available on Kaggle, Google Dataset Search, or government data portals. Once you are confident, start building a portfolio of small projects that show how you think and what you can do.
Need help preparing for interviews? Check out our data analytics interview questions guide. And remember, you don't have to do it alone. Join our Discord community and connect with others on the same journey.